

Want to enhance your website’s performance? Discover how GTmetrix can help identify the factors that impact your site’s visibility online.
With the vast number of tools available in the digital space, it’s nearly impossible to be familiar with each one.
There are always questions—what does the tool do? Is it free or paid? How exactly can it help? These doubts often arise when searching for the right tool to address website issues.
In this guide, we’ll explore GTmetrix, a tool designed specifically for testing website speed.
We’ll cover what it’s used for, how to navigate it, and how to interpret its results.
What Is GTmetrix?
GTmetrix is an online tool that evaluates the speed and performance of a website.
It measures metrics like load time, page size, and the number of requests, then assigns a performance score along with actionable suggestions for improvement.
It’s a valuable resource for website owners, developers, SEO specialists, and others looking to optimize their site’s performance.
How to Use GTmetrix
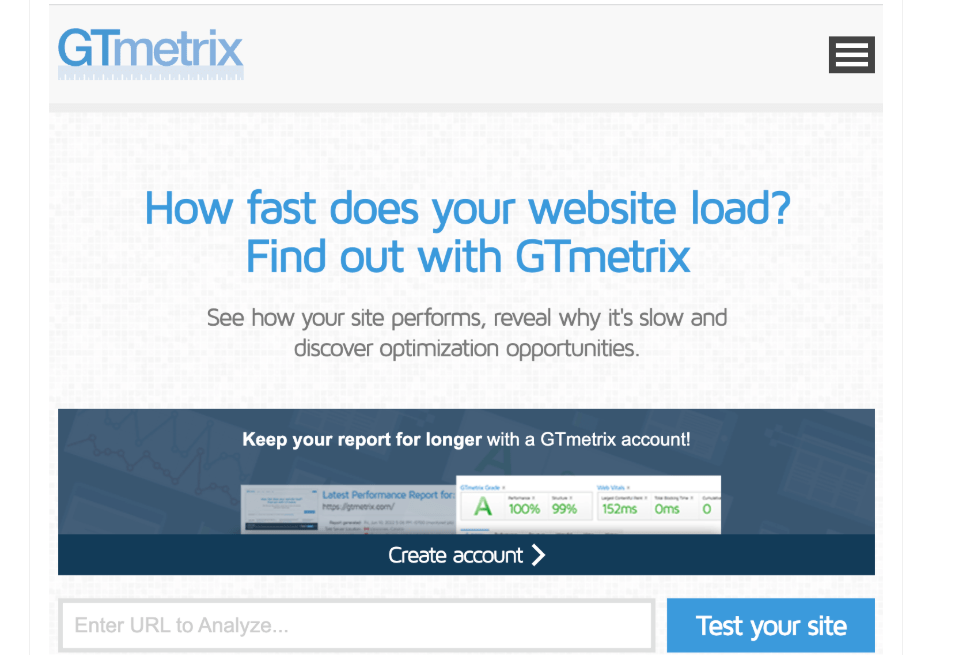
GTmetrix is accessible via a web browser, and you can begin using it without signing up.
However, creating a free account allows you to customize settings like test location and browser type.
To get started, simply enter your website URL into the GTmetrix homepage and begin the analysis.
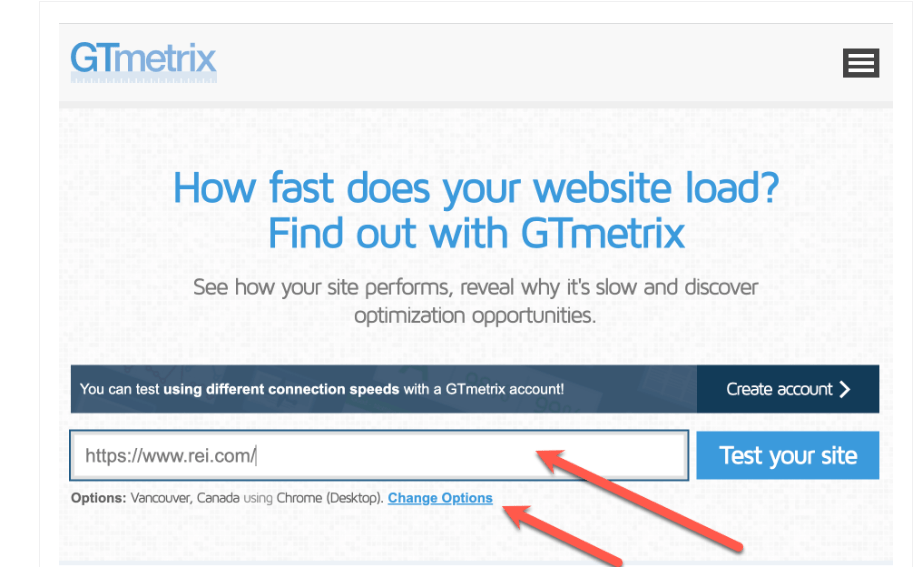
Once the analysis is complete, you’ll be able to examine the various metrics provided (we’ll explain what each one means in more detail below).
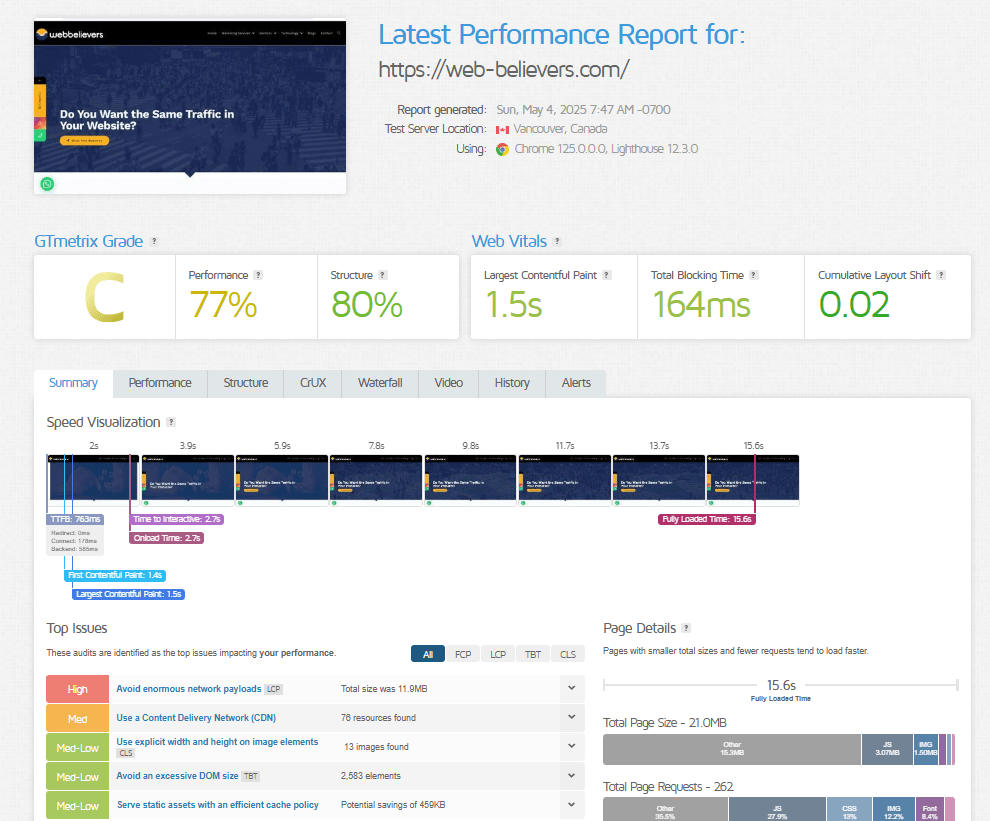
The report includes an overview featuring the GTmetrix Grade, Web Vitals, and a summary that highlights key speed visualizations.
The speed visualization offers a snapshot of how your website appears during loading, with performance data layered on top.
Further down the report, you’ll find a list of major issues categorized by performance metrics: First Contentful Paint (FCP), Largest Contentful Paint (LCP), Total Blocking Time (TBT), and Cumulative Layout Shift (CLS).
Each issue is also labeled with its level of impact, making it easier to decide which ones to address first.
While these metrics are shown right after the test runs, GTmetrix advises paying closer attention to the detailed audits found under the Structure tab.
Let’s explore the different tabs in GTmetrix and how each one can help you analyze your website.
Performance Tab
This tab gives you a detailed look at key performance metrics such as First Contentful Paint (FCP), Speed Index, Cumulative Layout Shift (CLS), and other browser-specific data points.
Structure Tab
GTmetrix recommends starting here. This section displays the results of various audits the tool performs and highlights their level of impact on your site’s performance.
Each audit comes with detailed information outlining what needs to be fixed.
Many of the insights are technical, but GTmetrix includes a helpful “learn how to improve this” link that directs you to a wiki page. There, you’ll find deeper explanations about how each issue affects performance, how it works, and ways to resolve or prevent it.
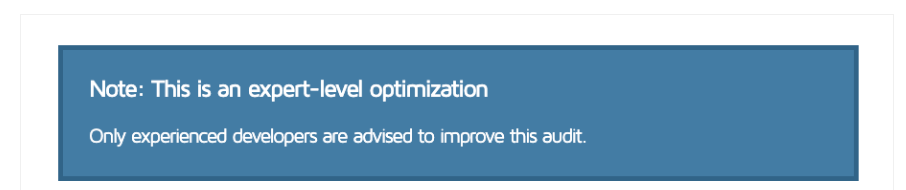
What makes this feature especially useful is that it also indicates the skill level required to implement each suggested optimization.
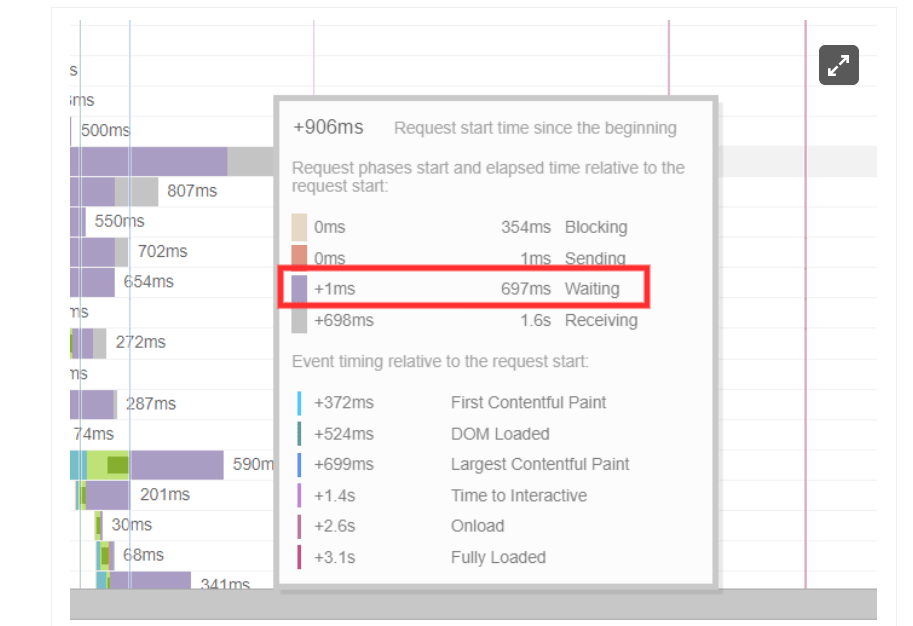
Waterfall Tab
This tab displays a waterfall chart that breaks down each resource loaded on your website in sequential order.
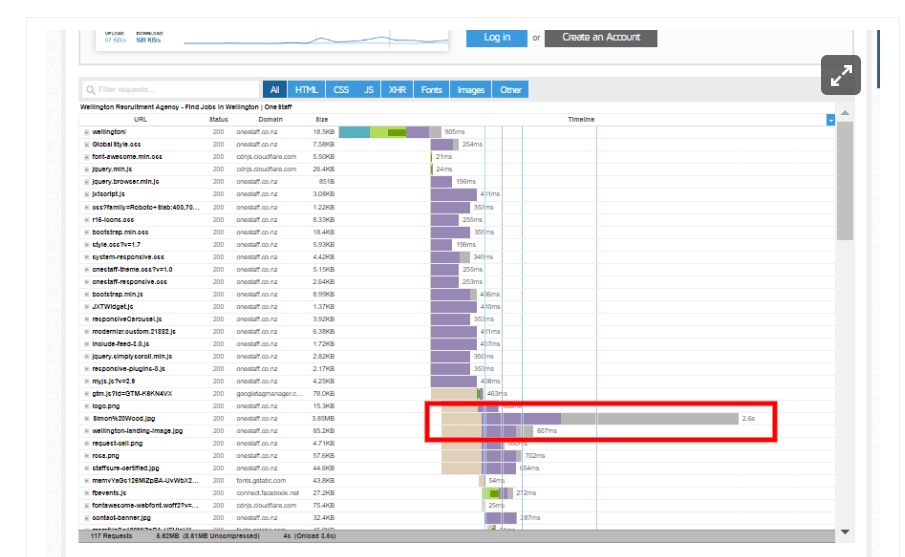
It’s useful for identifying resources that take longer than expected to load. By hovering over any row, you can view a detailed breakdown explaining the delay. For instance, if a server response takes around 700ms, it may point to a backend issue that could potentially be improved by using a CDN.
Video Tab
The Video tab allows you to record a video of your page loading, helping you visually identify issues during the process. To access this feature, you’ll need to create a GTmetrix account.
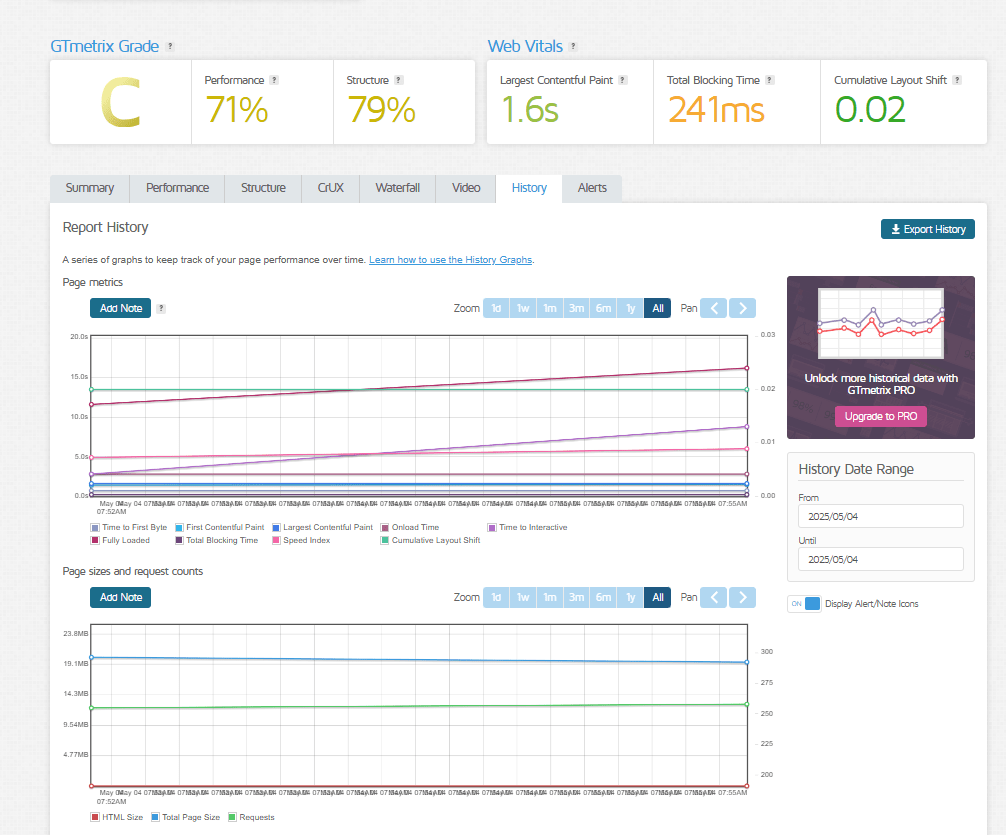
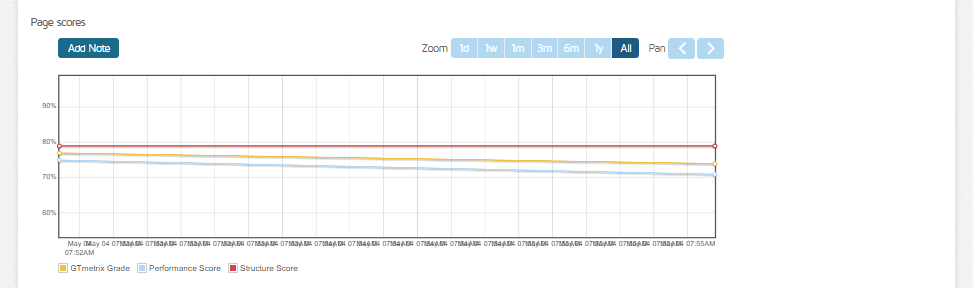
History Tab
This section offers graphs that track your website’s performance over time, showing trends in metrics like page size, interaction time, and performance scores.
It’s an effective way to monitor improvements and evaluate the impact of your optimization efforts.
What GTmetrix Measurements Mean
As mentioned earlier, GTmetrix provides an overall score, but it’s equally important to understand what each measurement represents.
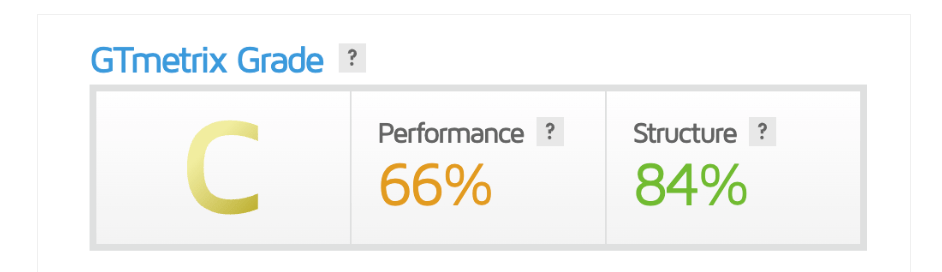
GTmetrix Grade Overview
The GTmetrix Grade offers a snapshot of your website’s overall performance.
It’s calculated based on user load time and how well the site is structured for performance.
Websites that load quickly and are built with performance in mind typically earn higher grades. On the other hand, sites with slow load times or inefficient architecture tend to receive lower grades.
Performance Score
The Performance Score is similar to the Lighthouse Performance Score, as noted on the GTmetrix platform.
This makes it easier for users to interpret the results in context, especially if they’re familiar with Lighthouse metrics used in other tools.
Structure
The Structure score is a combination of GTmetrix’s own audit system and Lighthouse assessments.
It reflects how well your website is designed from a performance optimization perspective.
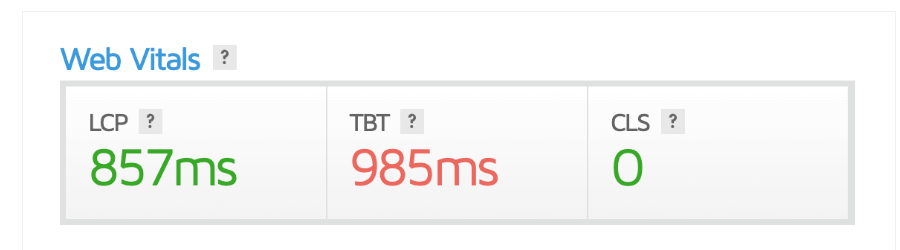
Web Vitals
This section focuses on key metrics that Google considers important for delivering what it calls “a delightful experience” to users.
Largest Contentful Paint (LCP)
LCP measures how long it takes for the largest visible element on your page to fully load.
For an optimal user experience, this should happen within 1.2 seconds or less.
Total Blocking Time (TBT)
‘TBT is a Lighthouse metric that gauges how responsive your site is during the loading phase.
It measures the total time during which user interaction is blocked, helping identify delays that prevent users from engaging with the page. TBT replaced the First Input Delay (FID) metric previously used in PageSpeed Insights.
Cumulative Layout Shift (CLS)
CLS tracks unexpected movements of page elements while the page is still loading.
This metric reflects how visually stable your website is and is also a key component of Google’s Web Vitals.
Conclusion
GTmetrix provides powerful insights and actionable data to help you improve your website’s performance.
It serves as an all-in-one tool to evaluate your site’s health and identify issues that could be impacting your search engine visibility.
By using GTmetrix, you can take meaningful steps to enhance your site’s speed, user experience, and overall online presence.
Frequently Asked Questions (FAQs)
1. Is GTmetrix free to use?
Yes, GTmetrix offers a free version that allows basic performance testing. However, to access advanced features like selecting test locations or recording videos, you’ll need a free account or a paid plan.
2. How often should I test my website with GTmetrix?
It’s a good idea to test your website regularly—especially after updates, design changes, or content additions. Monitoring over time helps track improvements or detect new issues early.
3. Does GTmetrix affect my website’s performance or traffic?
No, GTmetrix only analyzes your site and does not impact your live traffic or site performance.
4. Can GTmetrix tests be run on mobile devices?
Yes, GTmetrix allows you to simulate mobile performance testing, but this feature is available only with a registered account.
5. What is a good GTmetrix score?
A high GTmetrix grade, fast load times (under 1–2 seconds), and strong Web Vitals scores indicate a well-optimized site.